
Market Guide
From Nutrient Limits to New Treatment Systems: Where Wastewater Technology Demand Is Emerging
Nutrient limits now carry dates in San Francisco Bay, Puget Sound and Florida. Where a limit is set, the treatment technology it requires follows, years before a bid.
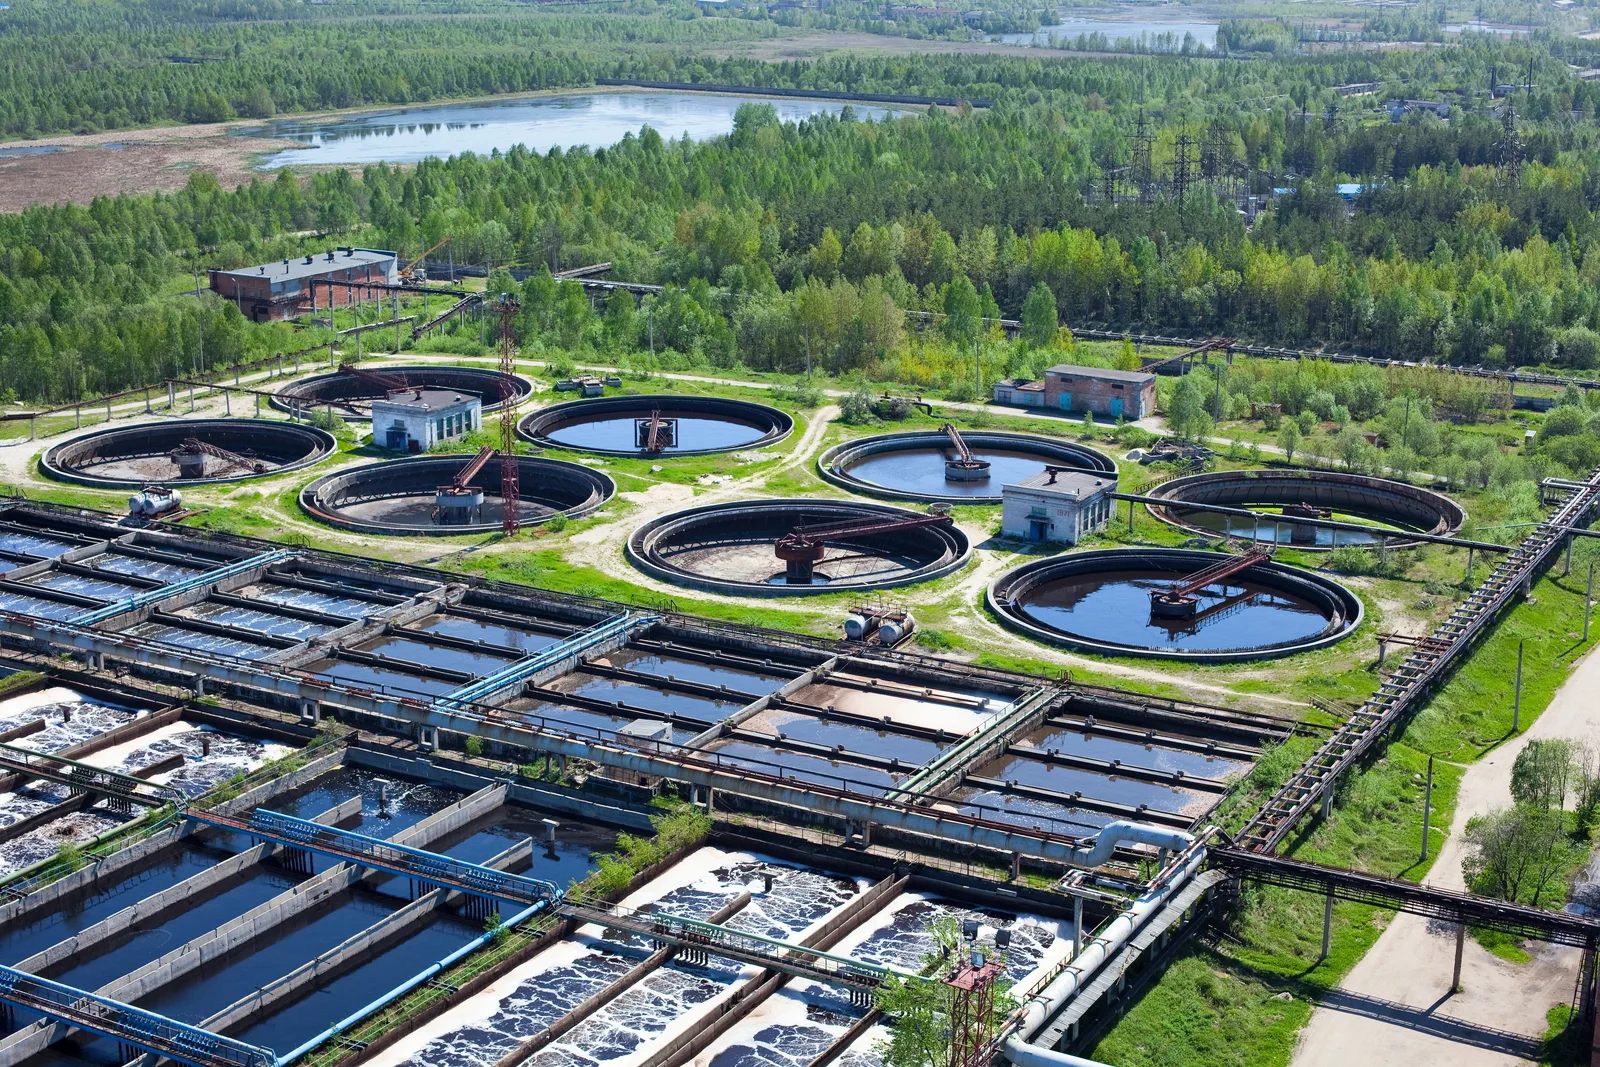
For most of the past fifty years, the regulatory question for a U.S. wastewater plant was how well it removed organic matter and solids. That question is largely settled. The one now reshaping capital budgets is nitrogen and phosphorus. Nutrients feed algal blooms, deplete oxygen and kill fish, and regulators in several of the country’s most valuable estuaries have moved from studying them to writing numeric limits into permits and statutes, with dates attached.
A numeric limit is a different kind of market signal from a water quality goal. It tells a utility how clean its effluent must be and by when, which in turn determines which treatment processes it must add. For engineering and construction firms, and for the equipment and technology providers whose processes get specified, the useful question is not whether nutrient regulation is tightening. It is where a limit has been set, how far the plants subject to it are from meeting it, and how long before that gap becomes a funded project.
The Scale of the Advanced Treatment Need
The national figures already point in this direction. The EPA’s 2022 Clean Watersheds Needs Survey puts the 20-year capital need for U.S. clean water infrastructure at $630.1 billion. Within it, advanced wastewater treatment, the category that covers treatment beyond the secondary level, including nutrient removal, accounts for $83.6 billion, more than the $66.6 billion reported for secondary treatment itself.[1]
Money to meet part of that need is in place. The Bipartisan Infrastructure Law added $11.7 billion to the Clean Water State Revolving Fund and a further $1 billion for emerging contaminants.[2] The EPA has also told states it will support “innovative permitting approaches that can drive deeper, sustained nutrient reductions” from point sources.[3] National numbers, however, do not say which plants will move first. That depends on the regional rules.
Four Regions at Four Stages of the Same Cycle
The Chesapeake Bay is the clearest record of what a nutrient regime does to a regional wastewater market. Under the Bay’s pollution limits, the 472 municipal and industrial treatment plants in the watershed cut their nitrogen discharges by 57% and their phosphorus discharges by 75% from 1985 levels, meeting the sector’s 2025 targets about a decade early.[4] The investment came in a wave of plant upgrades compressed into a few permit cycles. Today the demand there is mostly for optimization, operations support and replacement of the equipment installed during that wave, a smaller and steadier market than the one that preceded it.
San Francisco Bay is roughly where the Chesapeake was at the start of its wave. In 2024 the San Francisco Bay Regional Water Quality Control Board adopted its first nitrogen limits for the region’s publicly owned treatment works, requiring loads 40% below 2022 levels on a ten-year compliance schedule. The board acted after nutrients fueled the harmful algal bloom of summer 2022, which killed fish including protected sturgeon, and it has since directed staff to develop longer schedules for a narrow set of multi-benefit and conventional biological nutrient removal projects, which would change the timing of some projects but not the requirement.[5] The capital consequences are already in public budgets: the San Francisco Public Utilities Commission has budgeted $1.47 billion for nutrient reduction at its Southeast Treatment Plant, which handles about 80% of the city’s wastewater.[6] Other dischargers to the Bay face the same arithmetic on smaller scales, and most are still choosing their processes.
Puget Sound is further back, and for suppliers that makes it the most valuable stage. Washington’s Department of Ecology issued a Puget Sound Nutrient General Permit covering 58 treatment plants from January 2022; seven “dominant loaders” contribute more than 80% of the nutrients. In February 2025 the state’s Pollution Control Hearings Board invalidated the permit insofar as it was mandatory, and Ecology has since said it will set nutrient requirements through each plant’s individual permit instead.[7] The first of those modifications, proposed in June 2026 for King County’s West Point plant, Everett and Bellingham, requires the plants to evaluate treatment options through formal technology analyses and Nutrient Reduction Evaluations.[8] An evaluation of that kind is where a process is chosen. Firms known to a utility while it is being written help shape the specification; firms that arrive at the bid inherit it.
Florida has written its standard into statute. Advanced waste treatment, defined as effluent of no more than 3 milligrams per liter of total nitrogen and 1 milligram per liter of total phosphorus on an annual average, became mandatory for discharges to the Indian River Lagoon from July 1, 2025. The same requirement applies by January 1, 2033 to discharges into waters that fail nutrient standards or are covered by a nutrient basin management action plan.[9] Because that second category is defined by water quality rather than by a single estuary, it reaches many plants across the state on one fixed date.
What the Limits Buy
The stringency of a limit largely determines the technology it buys, which is why the limit itself is the most useful market signal. Moderate nitrogen limits can often be met by converting existing aeration basins to biological nutrient removal: anoxic zones, mixers, internal recycle pumps and better process control. That is retrofit work, heavy on mechanical equipment and instrumentation.
Limits at advanced treatment levels, such as Florida’s 3 mg/L nitrogen and 1 mg/L phosphorus, usually add a further stage, typically denitrification filters with supplemental carbon, chemical phosphorus removal and tertiary filtration. Plants on constrained sites that cannot expand their footprint are pushed toward process intensification, such as membrane bioreactors or granular sludge, and toward treating nutrient-rich sidestreams from solids handling separately. The SFPUC’s description of its new Treasure Island plant shows the end state: full-stream nitrogen reduction removing around 80% of nitrogen in tertiary treatment.[6] For equipment and technology providers, the practical implication is that a region’s limit narrows the set of competing processes long before an engineer writes a specification.
Reading the Sequence
Nutrient-driven projects follow a recognizable path through public documents, and each step narrows uncertainty. A limit is adopted, in a permit, a watershed permit or a statute, with a compliance date. The utility then studies its options in a facility plan or nutrient reduction evaluation and names a preferred process. The project enters a capital improvement plan, first as a study or placeholder, then with a budget by year. Financing follows, often through a state revolving fund loan that places the project on a public state list. Only then does procurement begin, increasingly through progressive design-build or construction manager at risk when a deadline is fixed.
Between the first step and the last there are usually several years. The plants worth attention are those where the first two steps are complete and the third has not yet hardened into a fixed scope. That is where problems are still being framed and where the choice of process is still open.
How FirmoGraphs Helps
At FirmoGraphs, an infrastructure intelligence company, this sequence is made practical. Wastewater AI, our wastewater platform, connects the discharge permits of U.S. treatment plants with their utilities’ capital improvement plans and board records, showing which plants face nutrient limits and which have begun to fund a response.
For engineering and consulting firms, this means business development time spent on utilities that are choosing a process rather than those that have already chosen one. For construction firms, it means aligning capacity and partnerships with the regions where compliance dates will compress a wave of upgrades into a few permit cycles. For equipment and technology providers, it means seeing where the next set of process decisions will be made, region by region and plant by plant, while there is still time to be part of them.
Nutrient limits do not create demand overnight; they set a clock. FirmoGraphs shows you which clocks have started, how much time is left, and which utilities are still deciding how to meet them.
References
- U.S. Environmental Protection Agency. “Clean Watersheds Needs Survey (CWNS): 2022 Results.” EPA, updated August 17, 2026. https://www.epa.gov/cwns
- U.S. Environmental Protection Agency. “Water Infrastructure Investments.” EPA, 2022. https://www.epa.gov/infrastructure/water-infrastructure-investments
- U.S. Environmental Protection Agency. “2022 EPA Nutrient Reduction Memorandum.” EPA, updated January 14, 2026. https://www.epa.gov/nutrientpollution/2022-epa-nutrient-reduction-memorandum
- Chesapeake Bay Program. “Wastewater sector meets nutrient goals of ‘pollution diet’ a decade early.” Chesapeake Bay Program, June 14, 2016. https://www.chesapeakebay.net/news/blog/wastewater-sector-meets-nutrient-goals-of-pollution-diet-a-decade-early
- San Francisco Bay Regional Water Quality Control Board. “Basin Plan Amendment to Support Nutrient Reductions.” California State Water Resources Control Board, updated July 28, 2026. https://www.waterboards.ca.gov/sanfranciscobay/water_issues/programs/planningtmdls/amendments/NutrientsBPA.html
- San Francisco Public Utilities Commission. “Upgrading Our System to Reduce Nutrients.” SFPUC, 2026. https://www.sfpuc.gov/about-us/our-systems/sewer-system/upgrading-our-system-reduce-nutrients
- Washington State Department of Ecology. “Puget Sound Nutrient General Permit.” Ecology, 2026. https://ecology.wa.gov/regulations-permits/permits-certifications/nutrient-permit
- Washington State Department of Ecology. “Ecology proposes nutrient control requirements for three large wastewater treatment facilities.” Ecology, June 11, 2026. https://ecology.wa.gov/blog/june-2026/ecology-proposes-nutrient-control-requirements-for-three-large-wastewater-treatment-facilities
- Florida Legislature. “Florida Statutes, Section 403.086: Sewage disposal facilities; advanced and secondary waste treatment.” The Florida Senate, 2025. https://www.flsenate.gov/Laws/Statutes/2025/403.086